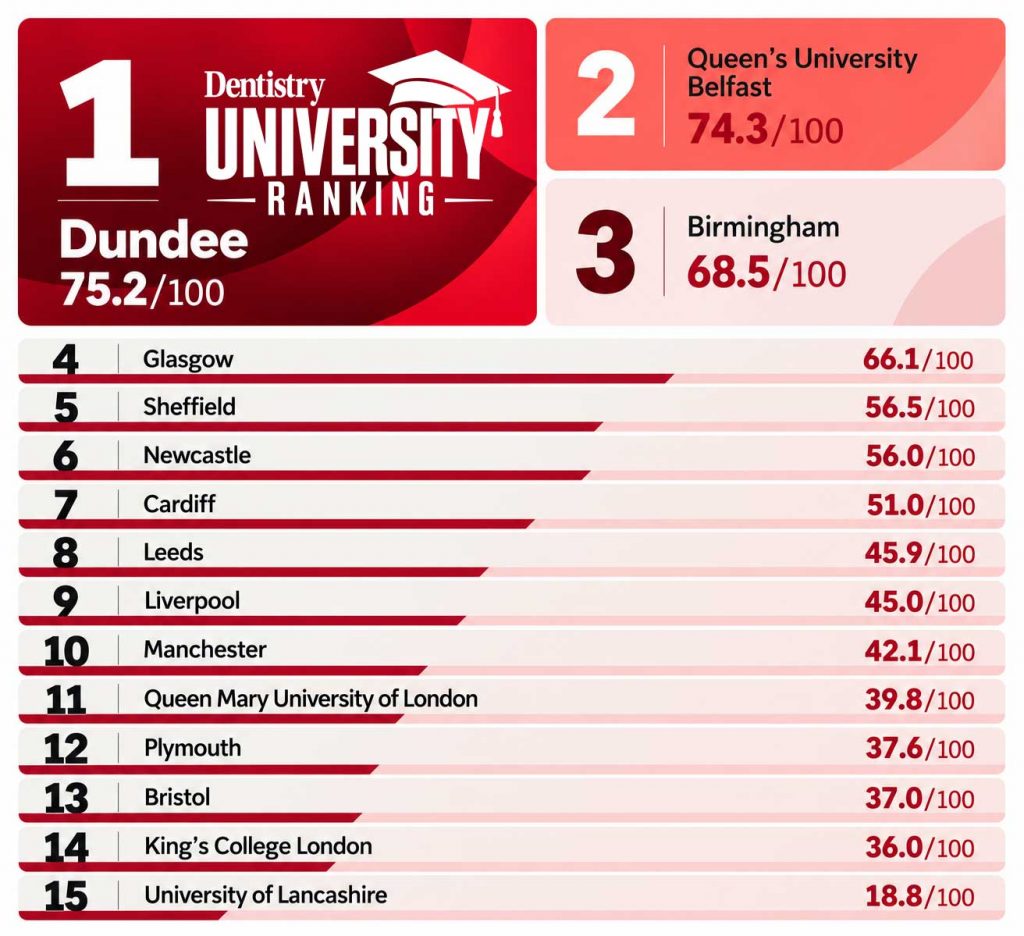
The University of Dundee has taken first place in a new Dentistry ranking designed around the factors we believe matter most in dental education.
Queen’s University Belfast finished narrowly behind Dundee, with Birmingham, Glasgow and Sheffield completing the top five.
Prospective dental students face no shortage of university league tables. But each provider measures something different, from graduate salaries and institutional spending to entry grades, student satisfaction and research. That can produce sharply different results and leave applicants unsure what each ranking actually says about a dental school.
We developed our own table to provide a distinctly dental comparison. It gives almost equal weight to students’ experience of their course and the strength of dentistry research produced by each university.
What did we measure?
The ranking draws on student responses covering teaching, assessment and feedback, as well as research influence, publication quality, entry standards, continuation rates and international research collaboration.
It excludes graduate employment because dentistry graduates generally enter a regulated profession with consistently strong employment prospects. University-wide spending and student-staff ratios were also removed because the published figures could not reliably show what was being spent on, or provided within, the dental school itself.
Dundee led the completed ranking with a score of 75.2, followed by Queen’s University Belfast on 74.3. Birmingham placed third on 68.5 and Glasgow fourth on 66.1.
Three dental schools not ranked
Three universities were not given numerical positions because comparable data covering all eight measures were not available. Their omission should not be interpreted as placing them below the 15 ranked universities.
| University | Why was it not ranked |
| University of Aberdeen | The General Dental Council lists its Bachelor of Dental Surgery programme as being delivered in conjunction with Dundee Dental School. We could not identify a sufficiently separate and complete Aberdeen dataset across the eight measures. |
| University of East Anglia | Its new programme has been provisionally accepted by the General Dental Council. It does not yet have a graduating cohort or enough established dentistry-specific teaching, continuation and research data for a like-for-like comparison. |
| University of Portsmouth | Its new programme has been provisionally accepted by the General Dental Council. It does not yet have enough historical dentistry-specific data for a like-for-like comparison |
Dentistry application deadline
Applications for most dentistry courses starting in 2027 must reach the Universities and Colleges Admissions Service by 18:00 UK time on 15 October 2026 to receive equal consideration.
Applicants should check the deadline attached to their chosen course before applying.
Read the full UCAS deadline information.
Scores show relative performance under the Dentistry methodology. They are not pass marks or absolute measures of course quality.
View the Dentistry University Ranking 2027 in accessible text
| Rank | University | Score |
|---|---|---|
| 1 | University of Dundee | 75.2 |
| 2 | Queen’s University Belfast | 74.3 |
| 3 | University of Birmingham | 68.5 |
| 4 | University of Glasgow | 66.1 |
| 5 | University of Sheffield | 56.5 |
| 6 | Newcastle University | 56.0 |
| 7 | Cardiff University | 51.0 |
| 8 | University of Leeds | 45.9 |
| 9 | University of Liverpool | 45.0 |
| 10 | University of Manchester | 42.1 |
| 11 | Queen Mary University of London | 39.8 |
| 12 | University of Plymouth | 37.6 |
| 13 | University of Bristol | 37.0 |
| 14 | King’s College London | 36.0 |
| 15 | University of Lancashire | 18.8 |
Read our full methodology
What the ranking measures
The Dentistry dental school ranking compares UK dental schools using publicly available data on student experience, dental research, entry standards and student continuation.
There is no universally accepted method for ranking dental schools. The indicators were selected because they cover different aspects of dental education, were available for the 15 ranked providers and could be applied consistently across the group.
Different indicators and weightings would produce a different order. This table reflects Dentistry’s editorial judgement about the comparable public measures most relevant to prospective dentistry students. It is not a definitive assessment of course quality or graduates’ clinical competence.
Final weighting
| Area | Measure | Weight |
|---|---|---|
| Student experience | Assessment and feedback | 24.1% |
| Student experience | Student views of teaching | 17.2% |
| Dental research | Citations per paper | 15.5% |
| Dental research | Research H-index | 13.8% |
| Dental research | Papers in leading journals | 12.1% |
| Admissions | Entrants’ Universities and Colleges Admissions Service tariff | 8.6% |
| Student progression | Continuation | 6.9% |
| Dental research | International collaboration | 1.7% |
| Total | 100% |
Grouped into broader areas, the model gives:
- Dental research: 43.1%
- Student experience: 41.4%
- Admissions and continuation: 15.5%
Research receives substantial weight because research strength was one of the priorities agreed before the data was assembled. It is measured through several indicators so that the result does not depend on citation volume alone.
Assessment and feedback received the largest individual weighting because it was one of the original priorities, second only to academic reputation. It measures whether dentistry students consider assessment fair, feedback timely and comments useful in improving their work.
Its final 24.1% share also reflects the removal of university-wide spending and staffing measures that could not be isolated reliably for dentistry. The precise weighting is an editorial judgement, not a scientifically established threshold.
What each measure means
Assessment and feedback: 24.1%
This uses responses from dentistry students to the National Student Survey questions covering assessment and feedback. These ask whether assessment has been fair, marking criteria have been clear, feedback has been timely and comments have helped students improve.
It measures students’ reported experience. It does not directly assess the clinical standard or difficulty of a course.
Student views of teaching: 17.2%
This uses National Student Survey responses about teaching on the dentistry course, including whether teaching staff explain material clearly, make the subject engaging and support students’ learning.
It records students’ views of their teaching. It is not an external inspection of teaching quality.
Citations per paper: 15.5%
This measures how often a dental school’s research publications have been cited, relative to the number of papers it produced. It is intended to assess the influence of the average paper without automatically rewarding an institution solely for publishing a larger volume of research.
Citation results were calculated within dentistry but were not normalised for differences between dental research sub-fields or for the age of individual papers. Research areas with higher citation rates and papers published earlier in the period may therefore have an advantage.
Research H-index: 13.8%
The H-index combines the volume and citation record of a dental school’s research. A school has an H-index of 30, for example, if 30 of its papers have each received at least 30 citations.
The measure rewards institutions that have produced a sustained body of frequently cited dental research. It can favour larger and longer-established research departments.
Papers in leading journals: 12.1%
This measures the share of a dental school’s research published in journals rated at the highest levels by the Publication Forum.
It assesses where research has been published, not the quality of every individual paper. Journal classifications can also favour established fields and publication patterns.
Entrants’ UCAS tariff: 8.6%
This is the average Universities and Colleges Admissions Service tariff of students entering the course.
It provides an indication of the prior academic attainment of a university’s intake. It does not measure how much progress students make after admission and may be affected by different admissions policies or qualification routes.
Continuation: 6.9%
This measures the proportion of students who continue their studies rather than leaving their course.
Continuation can indicate student support and course stability, but it does not explain why an individual student left or transferred.
International collaboration: 1.7%
This measures the proportion of dental research produced with authors based in more than one country.
It provides a limited indication of a school’s international research connections. It has a low weighting because collaboration alone does not establish the quality or relevance of the resulting research.
How the scores were calculated
The source data used different units. National Student Survey results were percentages, citation measures were counts or averages, and entry standards were expressed as UCAS tariff points.
Results were therefore converted into percentile positions within the group before weighting. The highest-performing institution on an indicator received the strongest relative score and the lowest-performing institution received the weakest.
This allowed indicators expressed in different units to be combined and reduced the influence of extreme values. However, the method measures relative position rather than the size of the difference between universities. Two schools separated by a very small raw difference can therefore receive the same positional separation as two schools whose raw results are further apart.
Each relative score was multiplied by the weight assigned to that measure. The eight weighted results were then added to produce the final score out of 100. Scores were rounded to one decimal place.
The weights and missing-data rules were set before the final order was reviewed.
Data sources
The ranking uses the following public sources:
- National Student Survey 2026 data for assessment and feedback and student views of teaching
- OpenAlex for dentistry publication and citation data
- Publication Forum journal ratings for the leading-journals measure
- Guardian University Guide dentistry table for entry tariff and continuation data
- General Dental Council list of approved dentistry providers to check eligible dental programmes
- Discover Uni to check course identities and the availability of comparable course-level information
Other university league tables were reviewed as comparators, but their overall ranks were not entered into the calculation. This avoids counting the same underlying data twice and importing another publisher’s weighting decisions into the Dentistry model.
Measures that were excluded
Student-staff ratio and spending per student were removed because the available figures applied to the university as a whole and could not be isolated reliably for the dental school.
Graduate outcomes and employer reputation were also excluded. Dentistry has high employment levels following qualification, which limits the value of employment as a way to distinguish between schools. Comparable UK-wide, dental school-level employer-reputation data were not available.
The ranking does not directly measure:
- Clinical teaching hours or clinical case exposure
- The range or complexity of patients treated
- Clinical facilities available to individual students
- General Dental Council inspection judgements as a numerical score
- Student wellbeing
- Graduate clinical competence
- Foundation training performance
- Employment destination or earnings
- The cost of living in each university city
These are important considerations for applicants, but no complete and directly comparable public dataset was found for all eligible providers.
Why three universities are not ranked
The ranking includes 15 universities for which comparable results were available across the measures used.
The University of Aberdeen, the University of East Anglia and the University of Portsmouth are not given a numerical rank because a complete comparable set of values could not be obtained for the selected indicators. Missing results were not treated as zero and were not estimated from unrelated university-wide data.
Their omission does not mean that they performed below the 15 ranked universities. It means that there was not enough comparable evidence to calculate a score using the same method. They should be described as ‘not ranked’, not placed jointly at the bottom of the table.
How to interpret the table
The scores show relative performance within this group and under this weighting system. They are not pass marks and should not be read as absolute measures of educational quality.
A high research score does not, by itself, prove that undergraduate teaching or clinical training is better. National Student Survey scores report student opinion and can be affected by response rates and local expectations. Entry standards describe the intake, not the education subsequently provided.
The table should therefore be used alongside General Dental Council information, individual course details, open days, location, student support, clinical arrangements and applicants’ personal circumstances.
Create a free account for unlimited access — plus the Dentistry Bulletin delivered to your inbox.